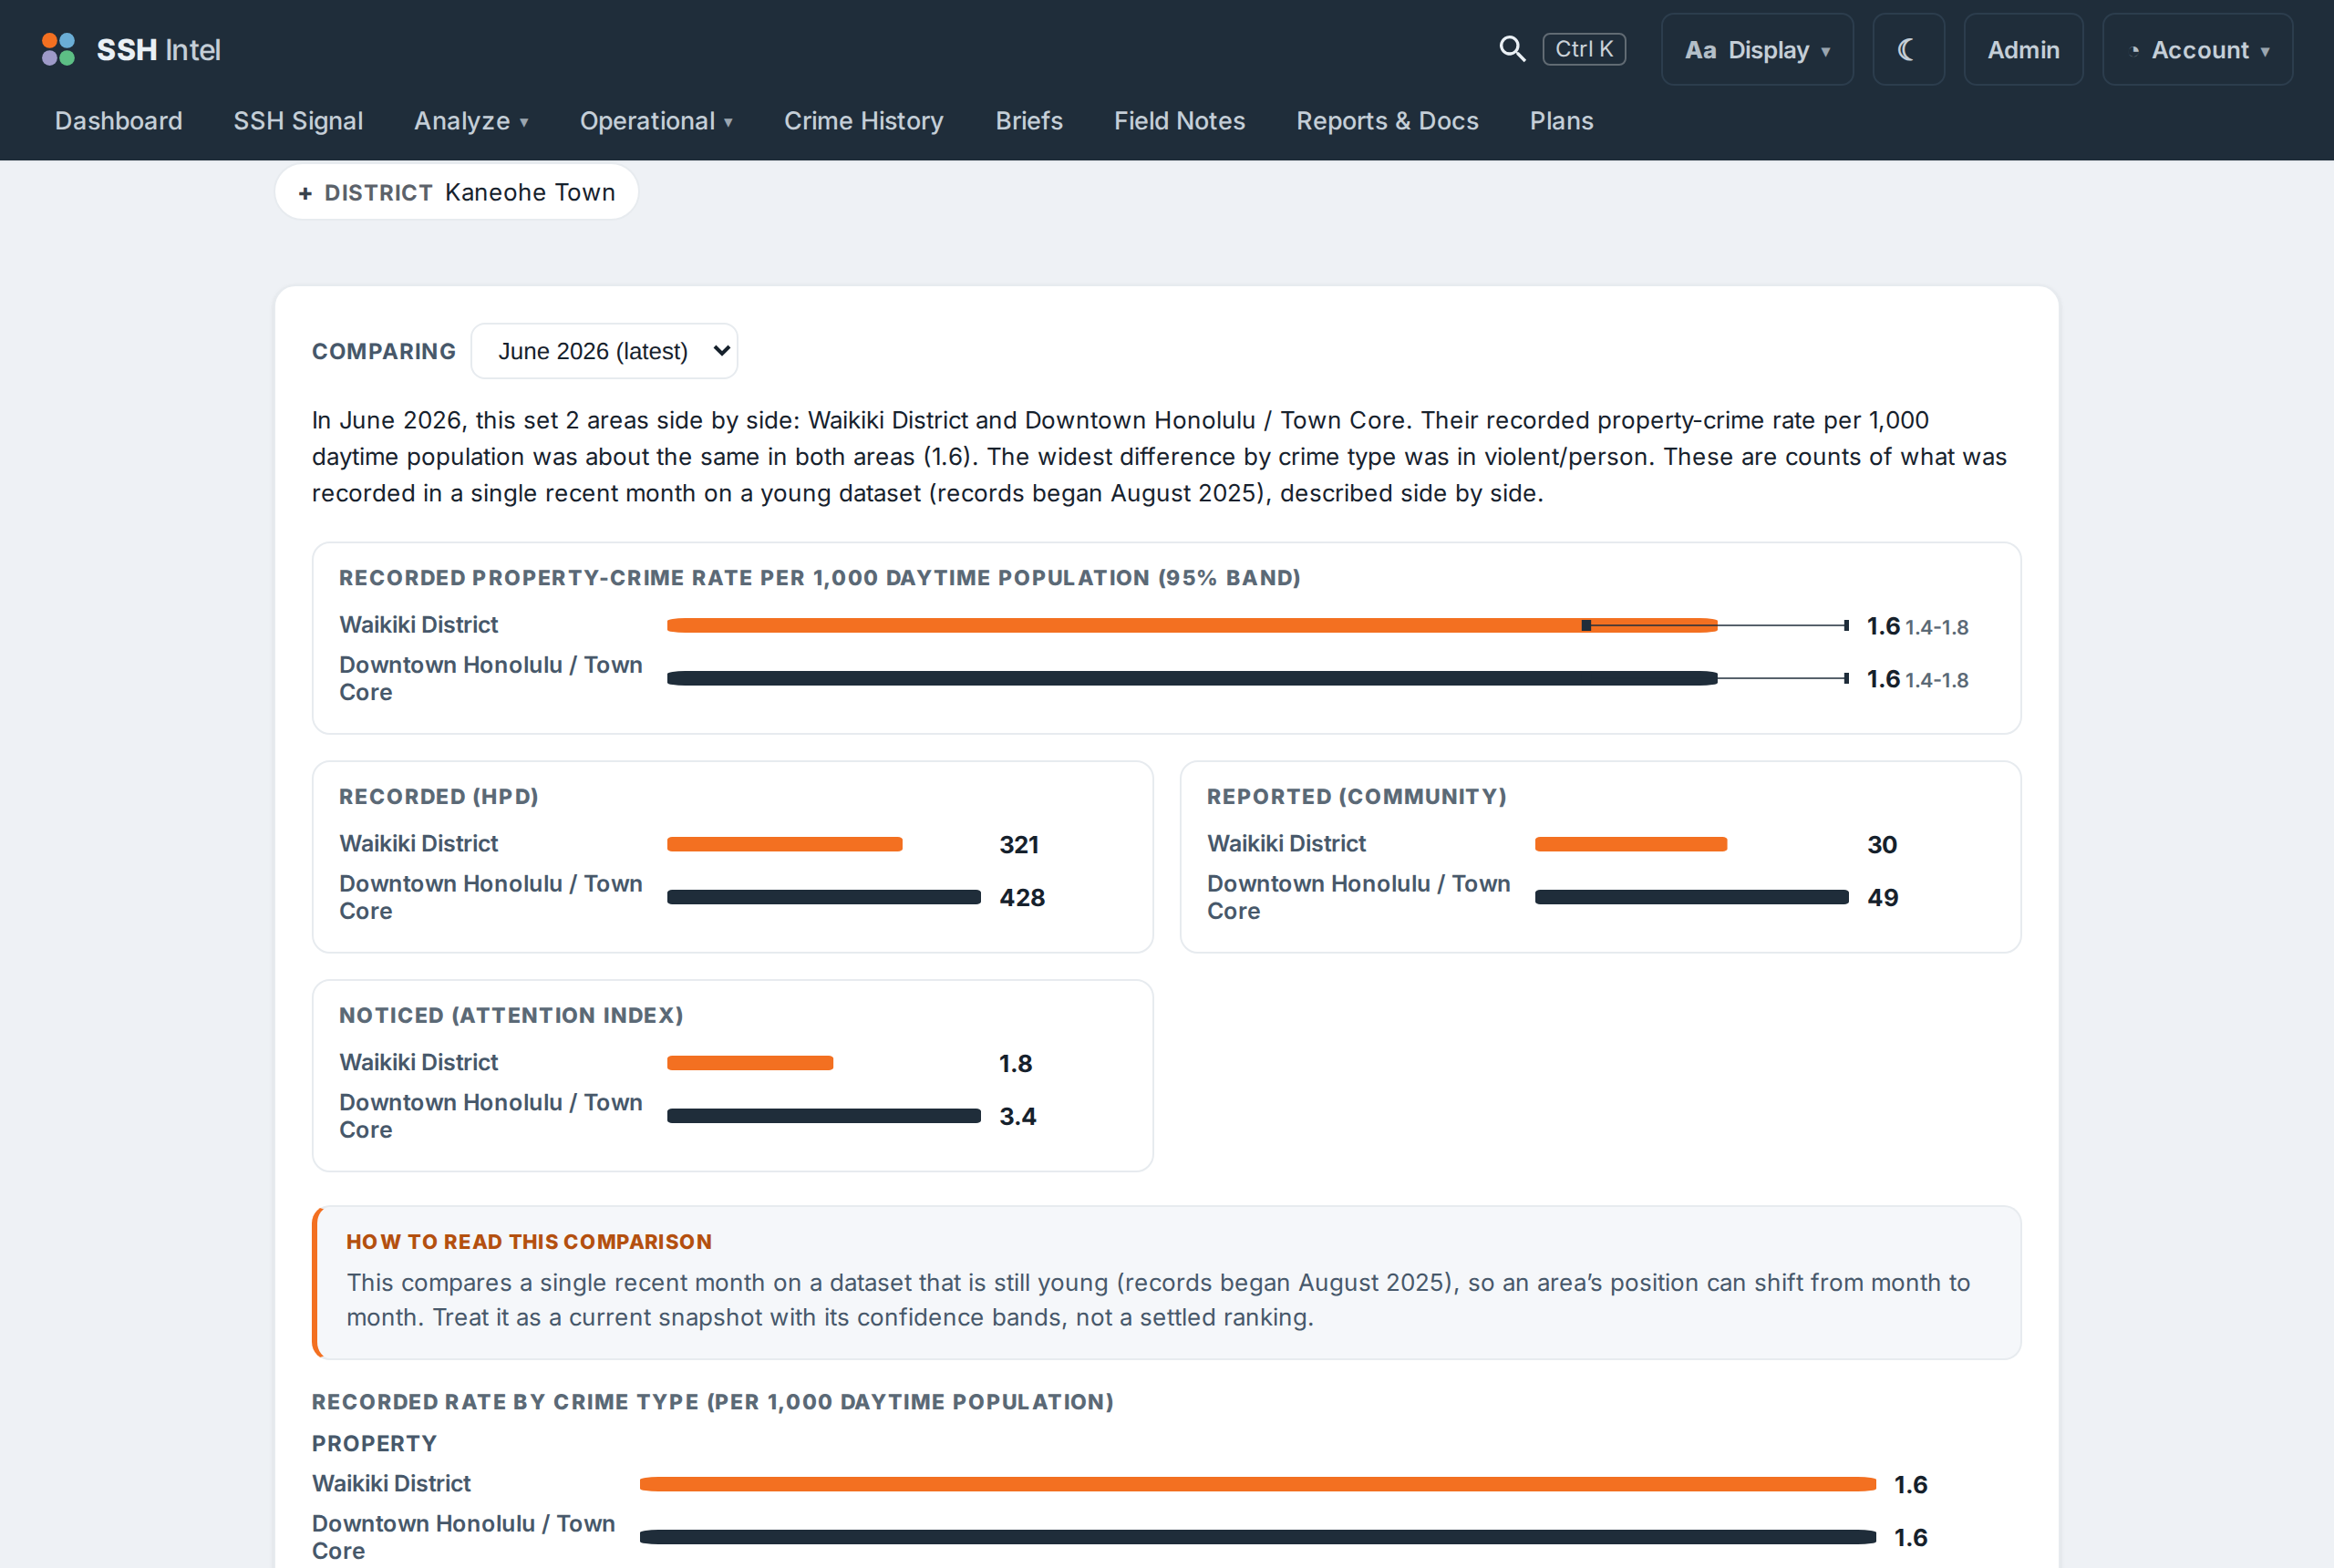
Compare puts areas next to each other fairly. Pick 2 to 4 areas and a complete month, and it shows them on the same per-capita basis with confidence bands, against the Oahu average.
How to use it
Click the area chips to select between 2 and 4 areas (you can only pick areas your plan covers). Choose a complete month. The comparison renders each area on the same per-capita scale so a busy district and a quiet one can be read against each other honestly.
Why the bands matter
Each area's rate carries a confidence band. When two areas' bands overlap, the difference between them is within the noise, read them as "about the same." A real difference is one where the bands clearly separate. Compare shows the bands precisely so you are not misled by a small gap.
What Compare will not do
It will not crown a "winner" or rank the areas from best to worst. It shows them side by side and lets you read the facts. Ordering places by crime is exactly the kind of ranking the product refuses to produce.
Last updated 2026-07-15 HST