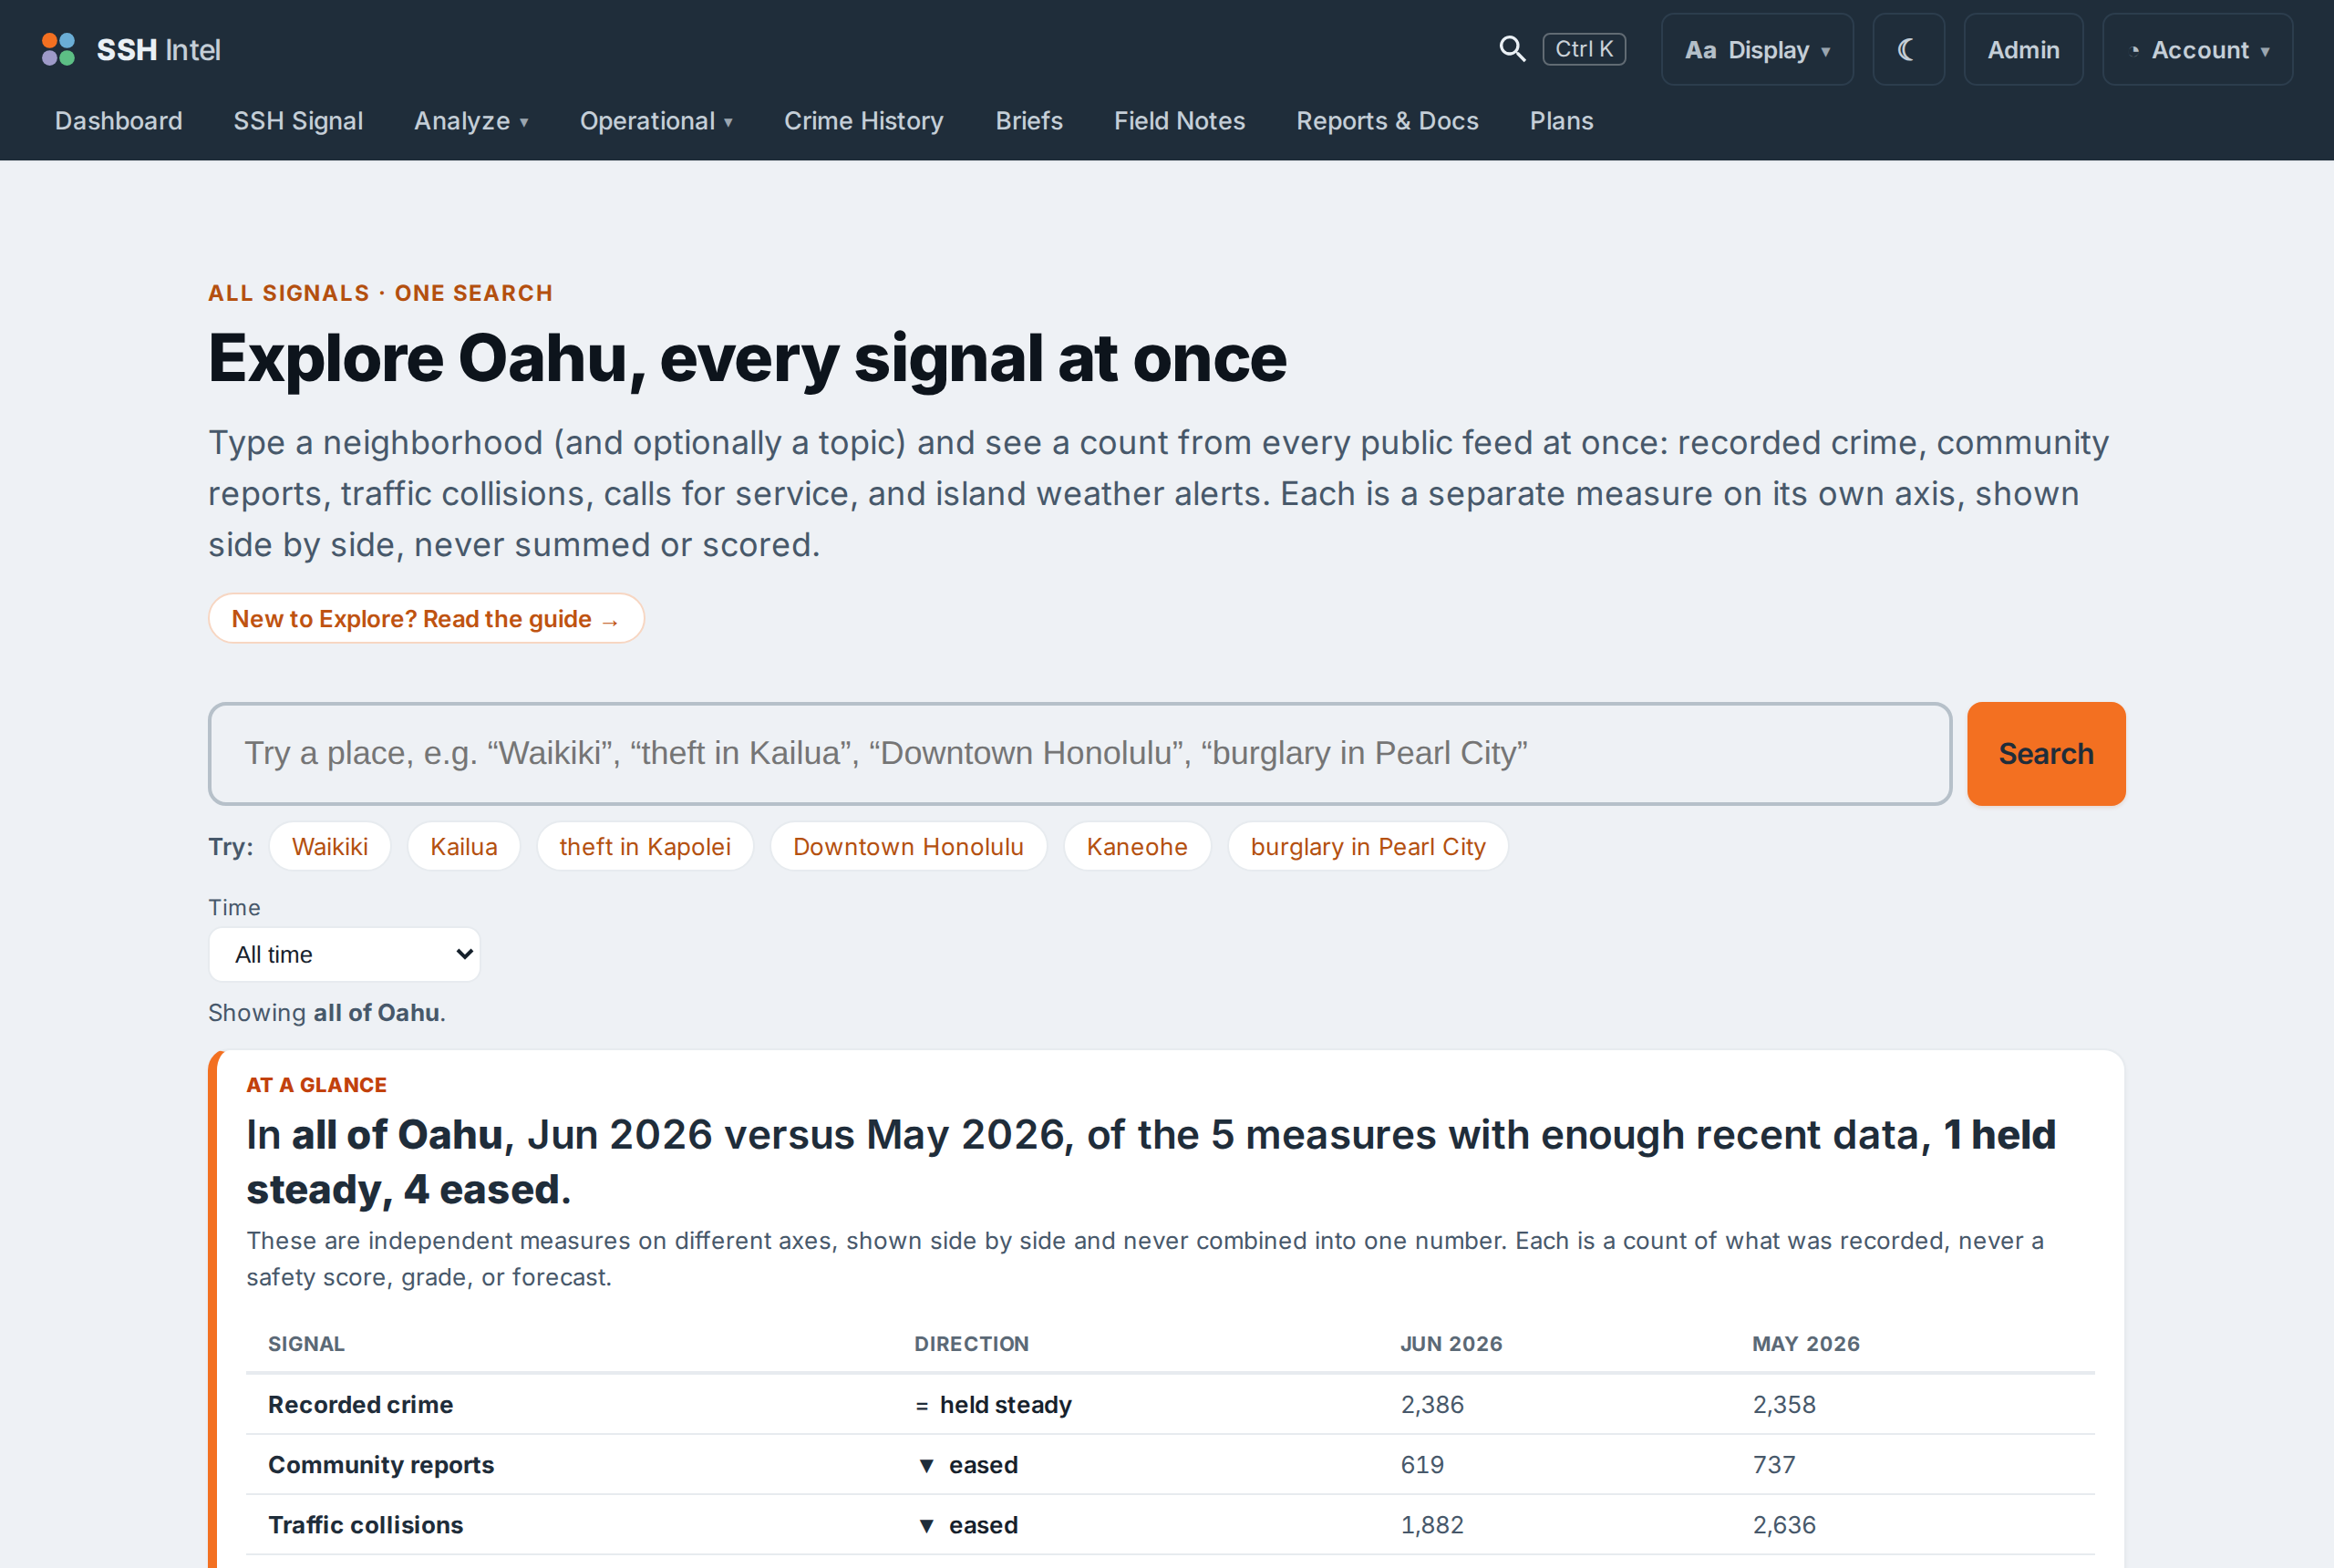
Explore answers "what does everything say about this place." Type a neighborhood (and optionally a topic), and it lays out a count from every signal at once, on separate axes, never summed into one number.
How to use it
Type a place ("Waikiki", "Downtown Honolulu") or a place with a topic ("theft in Kapolei"). Pick a Time window. The result is an "at a glance" comparison of the latest period against the one before, plus a breakdown per signal below.
Reading the direction column
Each signal gets a plain-language direction: rose, held steady, or eased. These describe what happened between two periods. They are never a forecast and never a verdict on the area.
Explore versus Search
Use Explore when you want the whole picture for a place at once. Use Search when you have a specific question in words. They share the same underlying pickers, so you can move between them.
Last updated 2026-07-15 HST