New here? This is the fastest path from signing in to a useful, sourced picture of your area. Five steps, about five minutes.
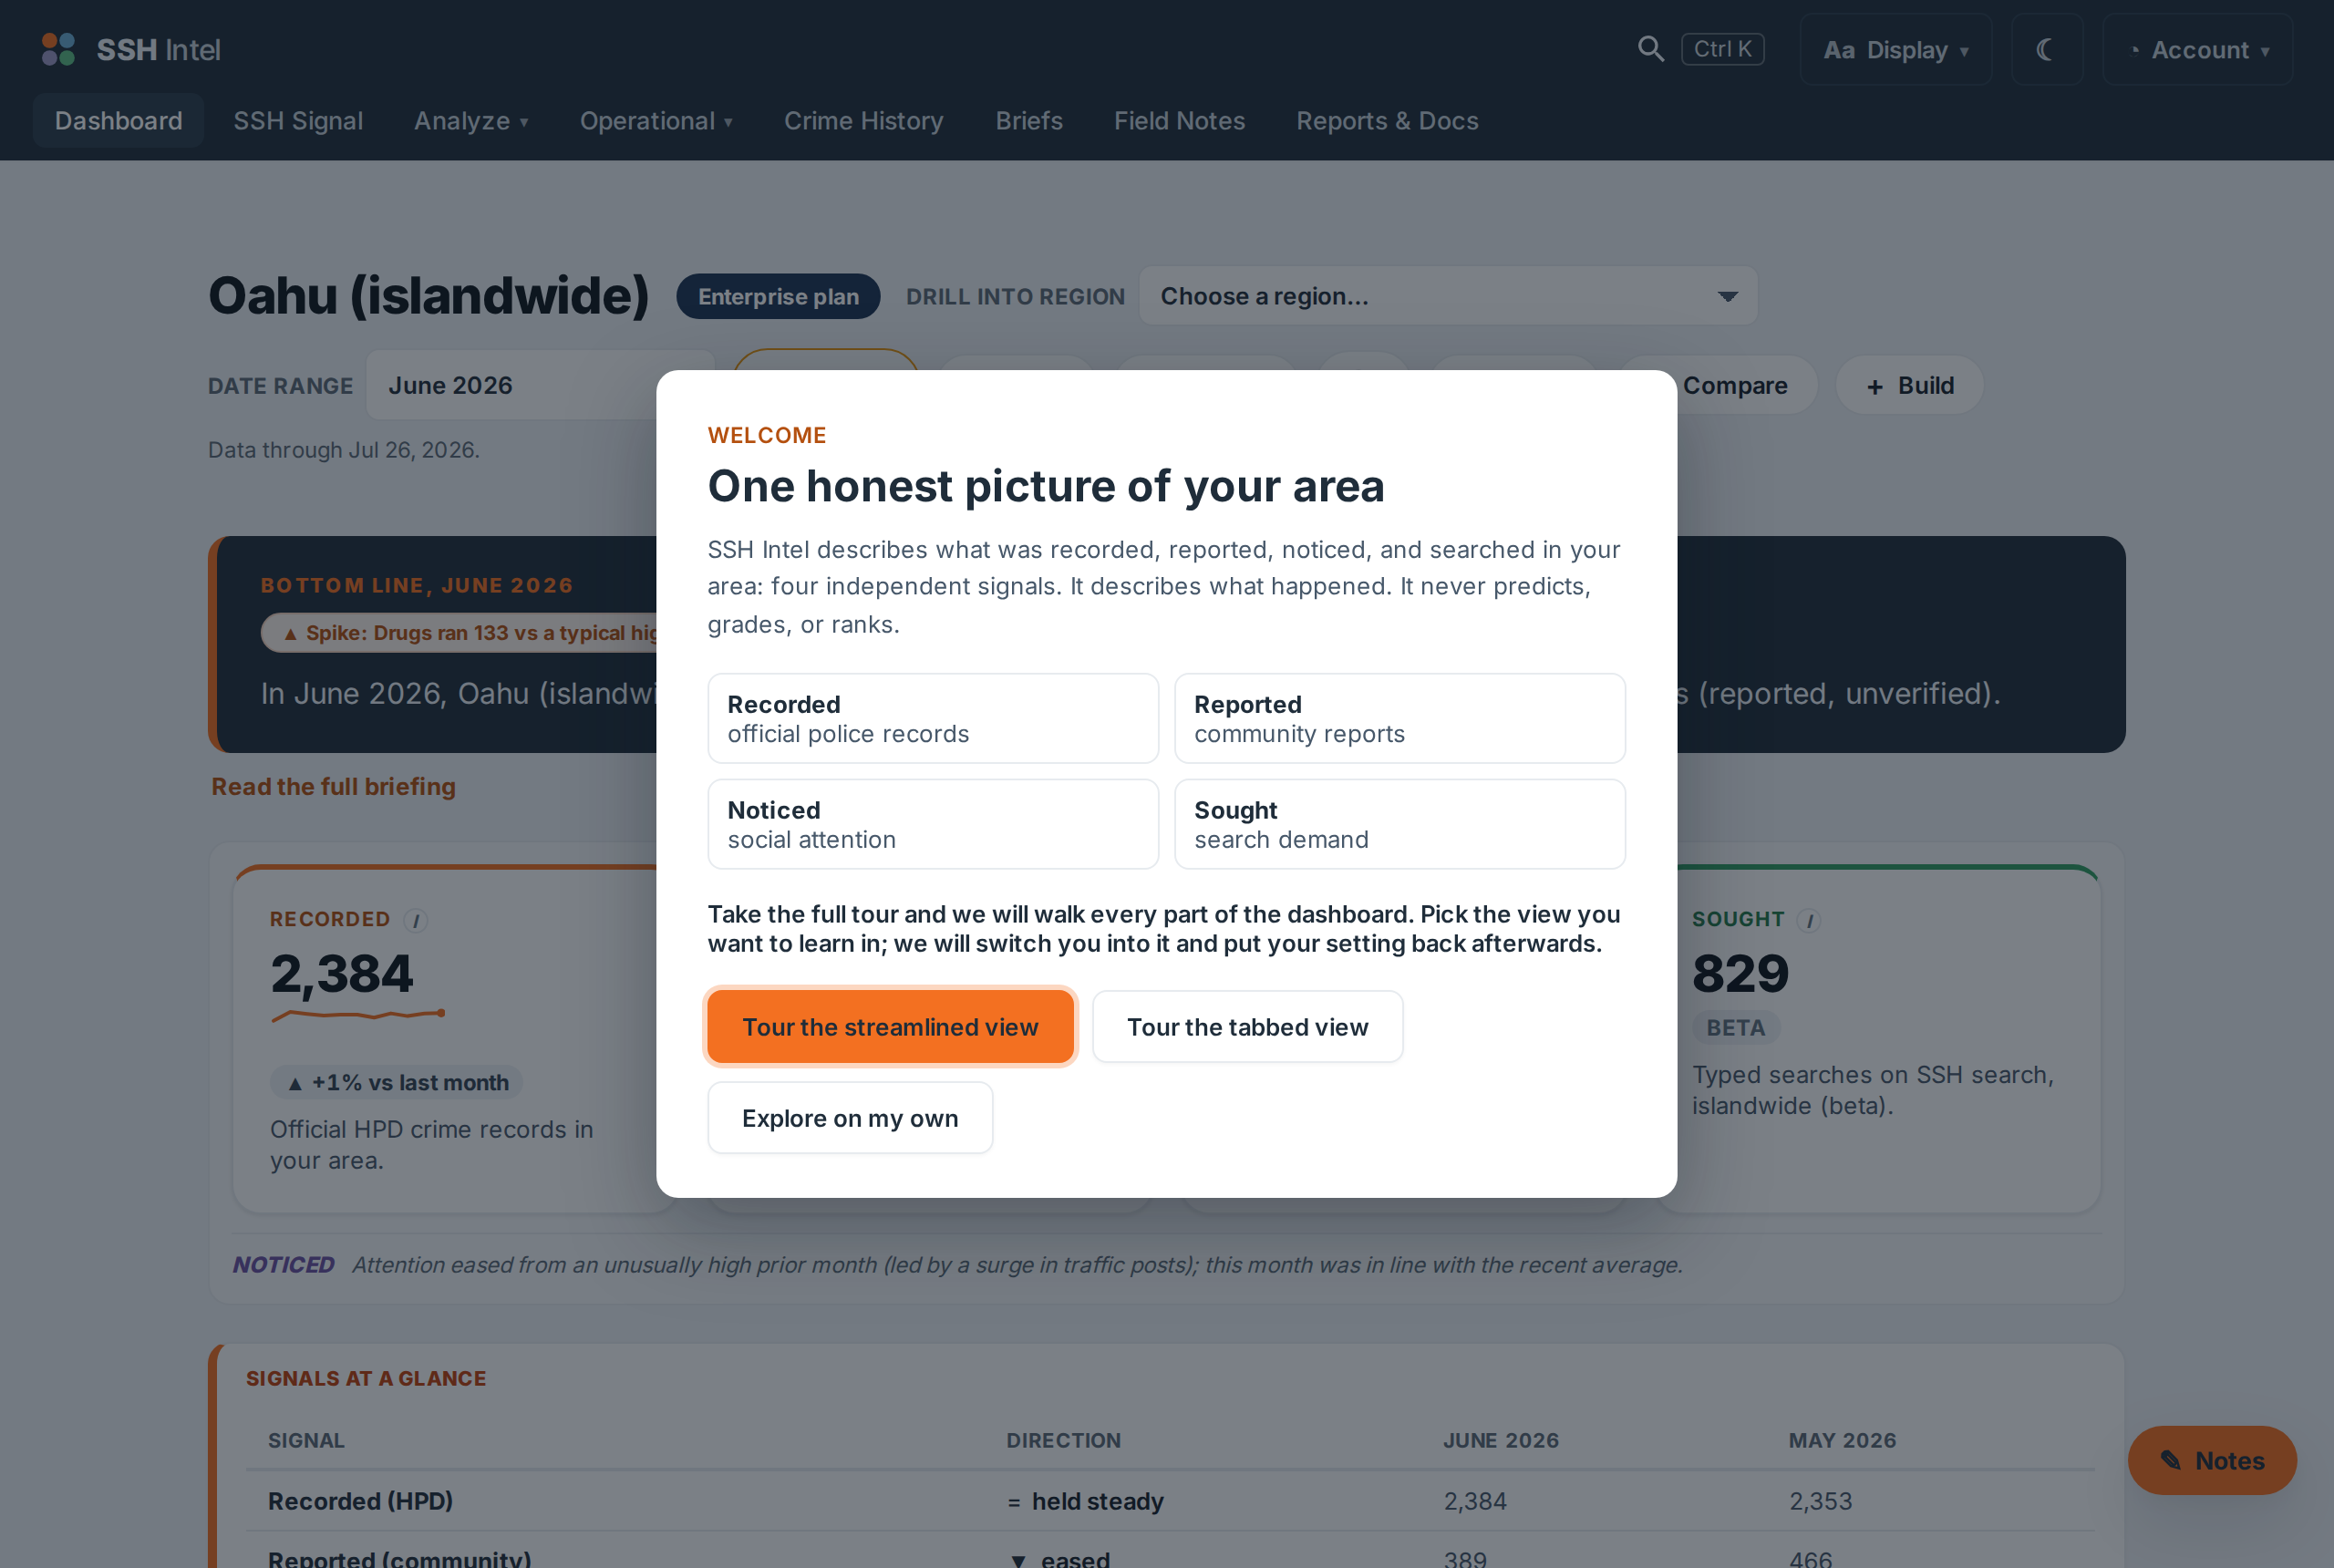
1. Open your report
Click Dashboard in the top nav (or go to the report). It opens on your area for the most recent complete month. If your plan covers more than one area, use Drill into region at the top to move between them.
2. Read the bottom line
The dark banner near the top is a plain-English briefing: how many official crimes and community reports were recorded, and anything notable (a spike, an easing). If a phrase is unfamiliar, keep reading, or open Reading the numbers.
3. Glance at the four signals
The four cards, Recorded, Reported, Noticed, and Sought, are the headline of the whole tool. Each shows a count, a small trend line, and how it moved versus last month. They are never added together.
4. Ask a question
Click into Search and type a plain question, like "vehicle theft in Kailua last 6 months." The tool reads your topic, area, and time window and writes back a short, sourced answer.
5. Compare, if it helps
Want context for a number? Compare two areas side by side against the Oahu average, on the same fair per-capita basis.
Last updated 2026-07-15 HST